Capitalism
Materials for class on Wednesday, January 9, 2019
Contents
Slides
Download the slides from today’s lecture.
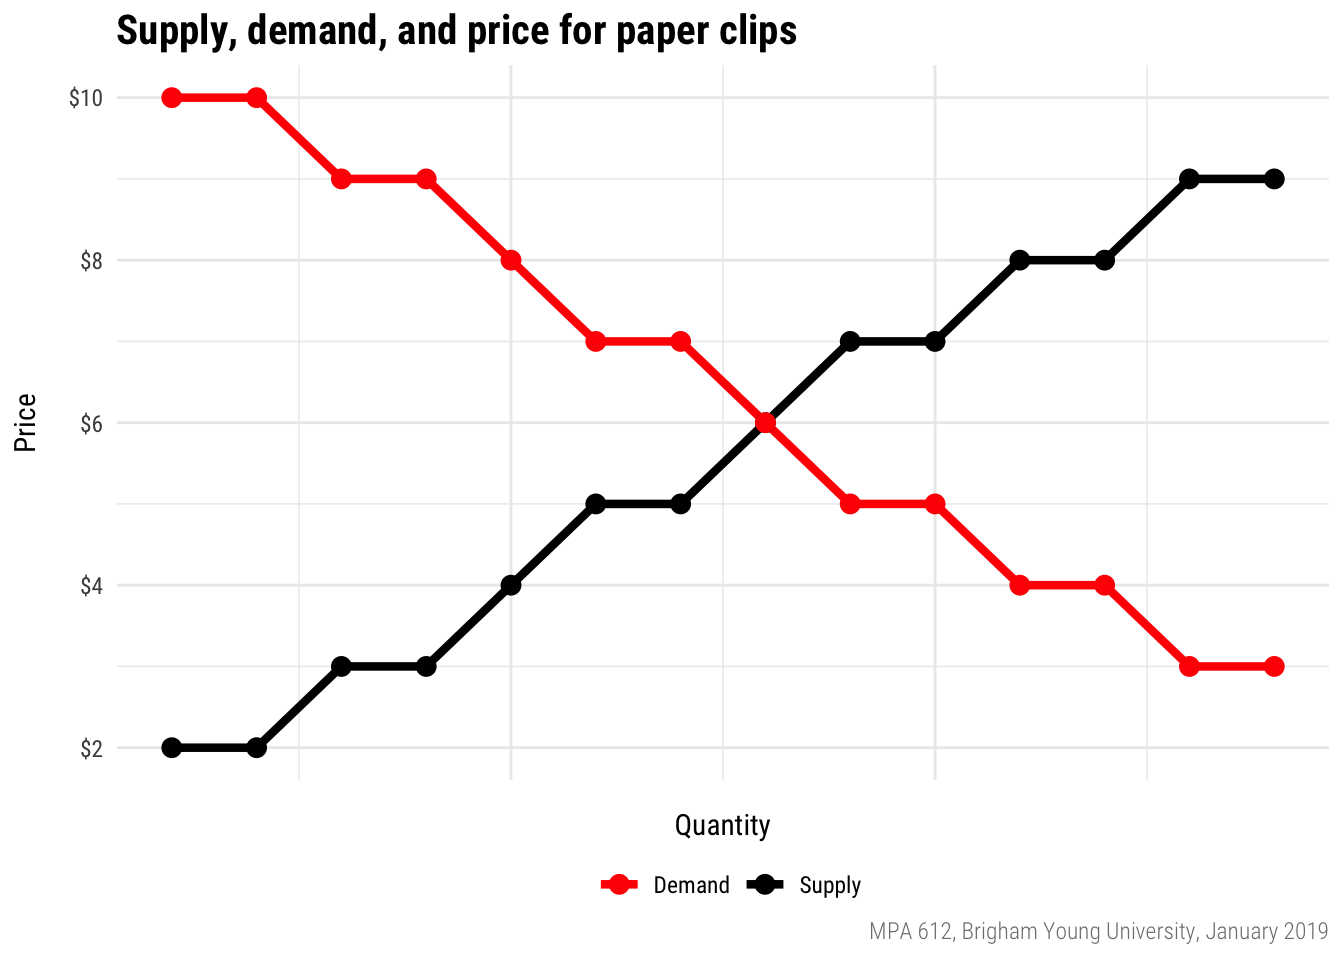
Pit market results
Here are the supply and demand curves for paper clips. With no taxation, the equilibrium price should be $6; with tax, it is $7, borne equally by buyers and sellers.
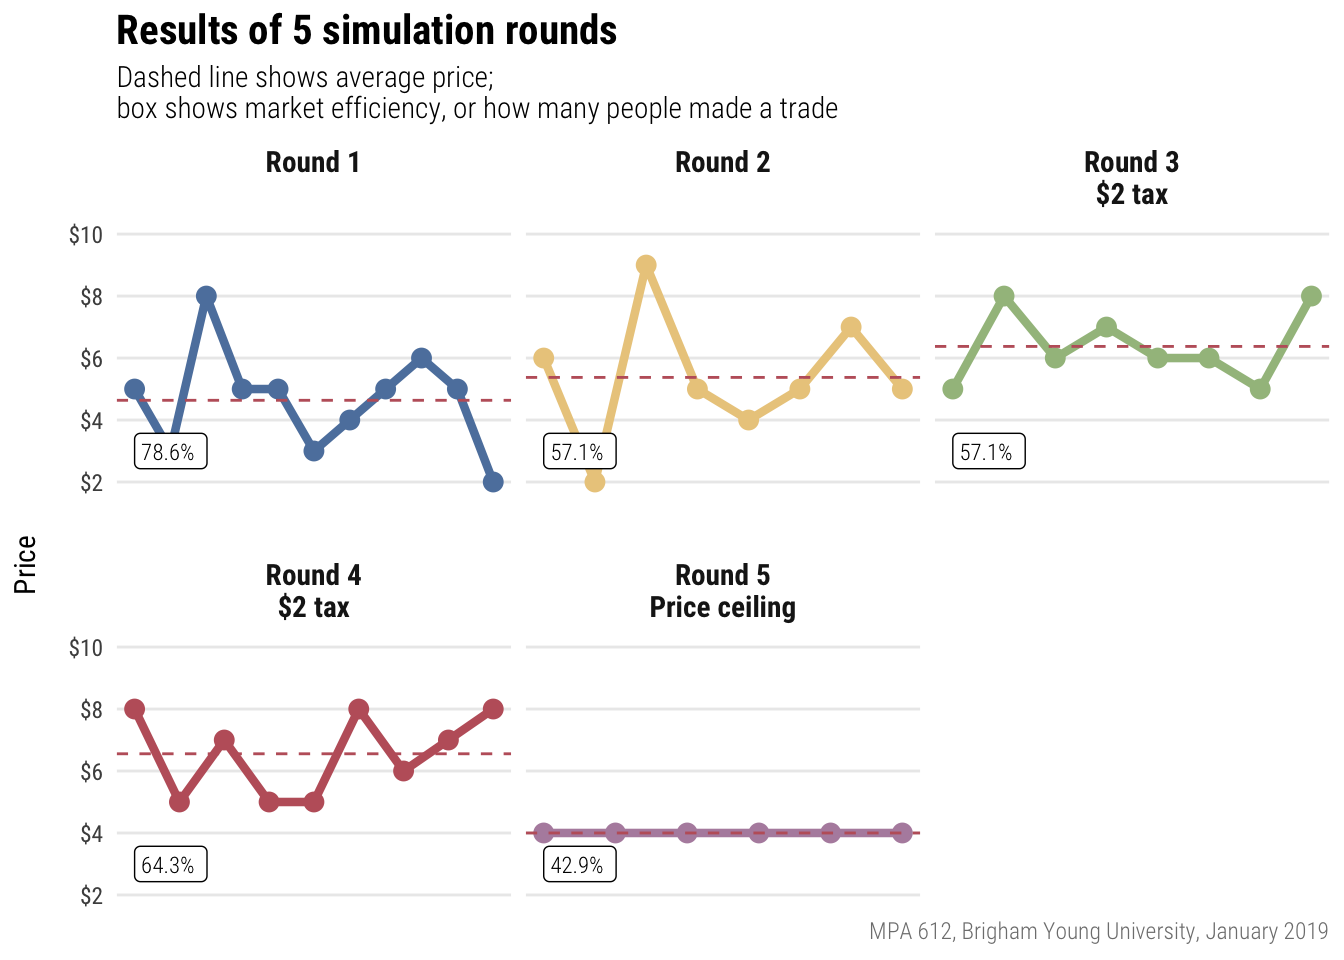
And here’s how you did!
Adjusting for inflation
Converting nominal values (the numbers written down at the time) to real values (the numbers in today’s / another year’s dollars):
\[ \text{Real value} = \frac{\text{Nominal value}}{\text{Price index / 100}} \]
Shifting the price index to a different year:
\[ \text{Price index}_{\text{new year}} = \frac{\text{Price index}_{\text{current year}}}{\text{Price index}_{\text{new year}}} \times 100 \]
Or, for the quickest and easiest method, use the BLS’s CPI inflation calculator.
Calculating the inflation rate
The inflation rate is the percent change in CPI between two periods. The formula for percent change is:
\[ \text{% change} = \frac{\text{New} - \text{Old}}{\text{Old}} \]
or
\[ \text{% change} = \frac{\text{Current} - \text{Previous}}{\text{Previous}} \]
The CPI in January 2010 was 217.488, and it was 249.245 in January 2018. The total inflation over the past 8 years is \(\frac{249.245 - 217.488}{217.488}\), or 14.6%.
Economic indicators
- GDP (nominal)
- GDP deflator
- CPI
- Personal income (nominal)
- Population
- Personal income per capita (nominal)
- Health expenditures per capita (nominal)
Adjust for inflation with Excel
We made this spreadsheet in class to show how to adjust for inflation, change the base year of the CPI, and calculated inflation rates:
We used these raw Excel files to do this:For the morbidly curious, you can see the R code I used to download and compile this data from FRED at the daytime MPA class website.
Clearest and muddiest things
Go to this form and answer these three questions:
- What was the muddiest thing from class today? What are you still wondering about?
- What was the clearest thing from class today?
- What was the most exciting thing you learned?
I’ll compile the questions and send out answers after class.